How to Use Quiz Analytics
Quiz Analytics gives you a dedicated analytics page for every quiz, split into two tabs. Response Analytics shows how customers move through your quiz and what they answer. Product Analytics shows revenue, conversions, and which products your quiz is driving.
Prerequisites
- You have at least one quiz created and published in SEA Survey
- Your quiz has received at least one response
Steps
Step 1: Open Analytics
In the SEA Survey sidebar, click Analytics.
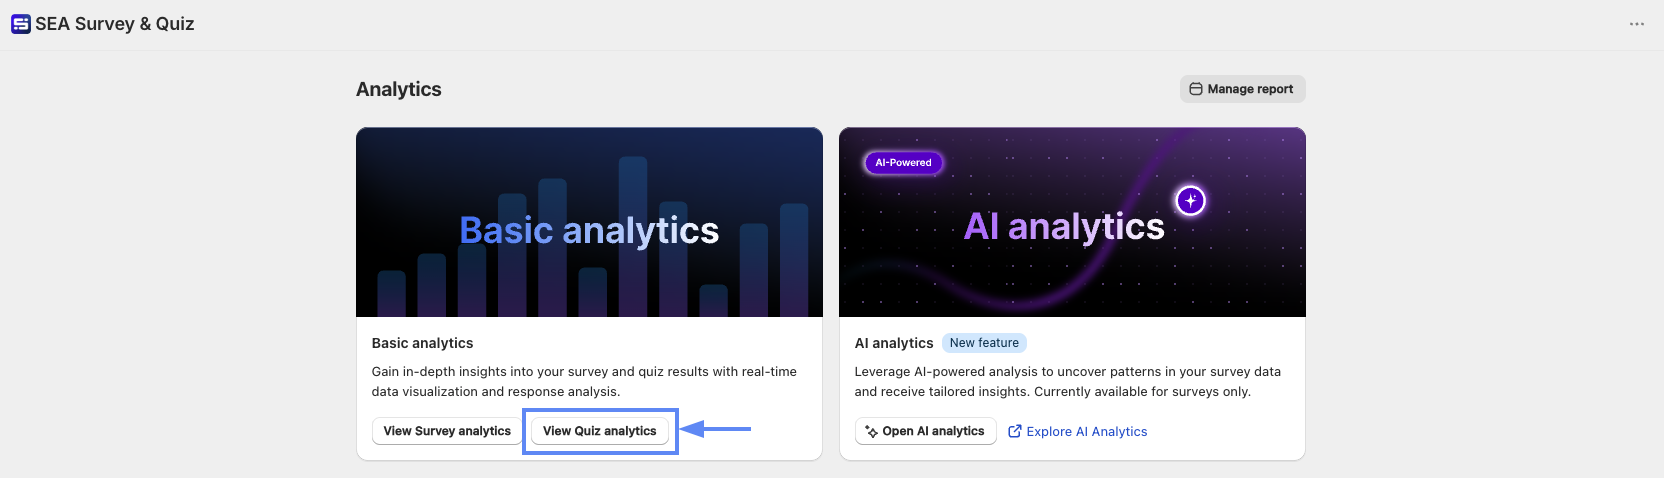
Step 2: Open Quiz Analytics
In the Basic analytics card, click View Quiz analytics.
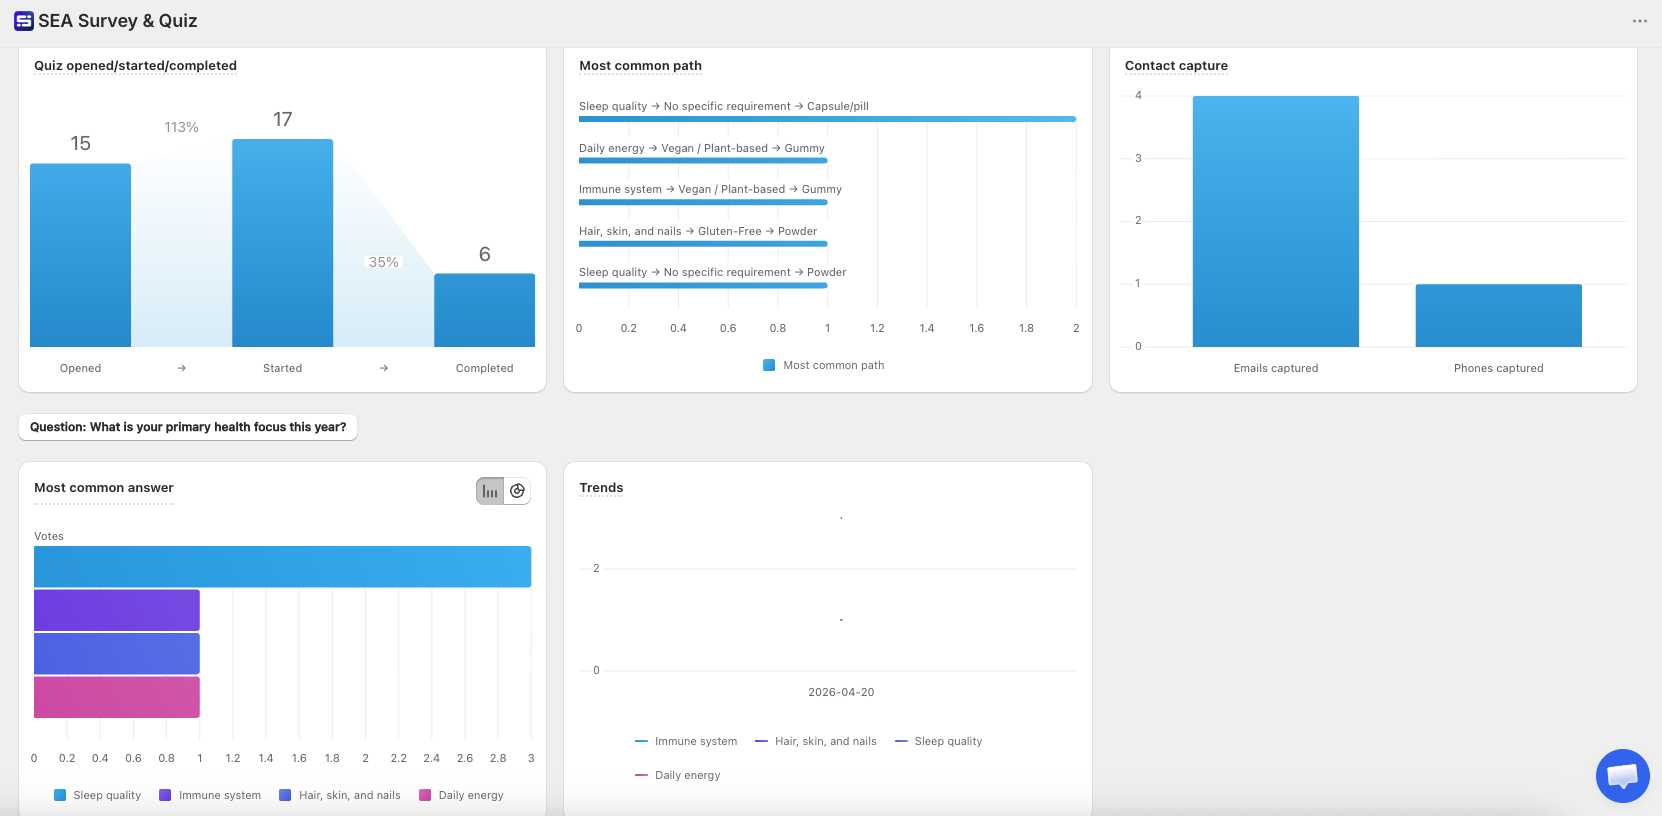
Step 3: Read Response Analytics
The page shows how customers interact with your quiz:
- Quiz opened/started/completed: Drop-off rate across each step from Opened to Started to Completed
- Most common path: The combination of answers that appears most often
- Contact capture: Total emails and phone numbers collected from the quiz
- Most common answer: The top answer per question
- Trends: Response volume over time
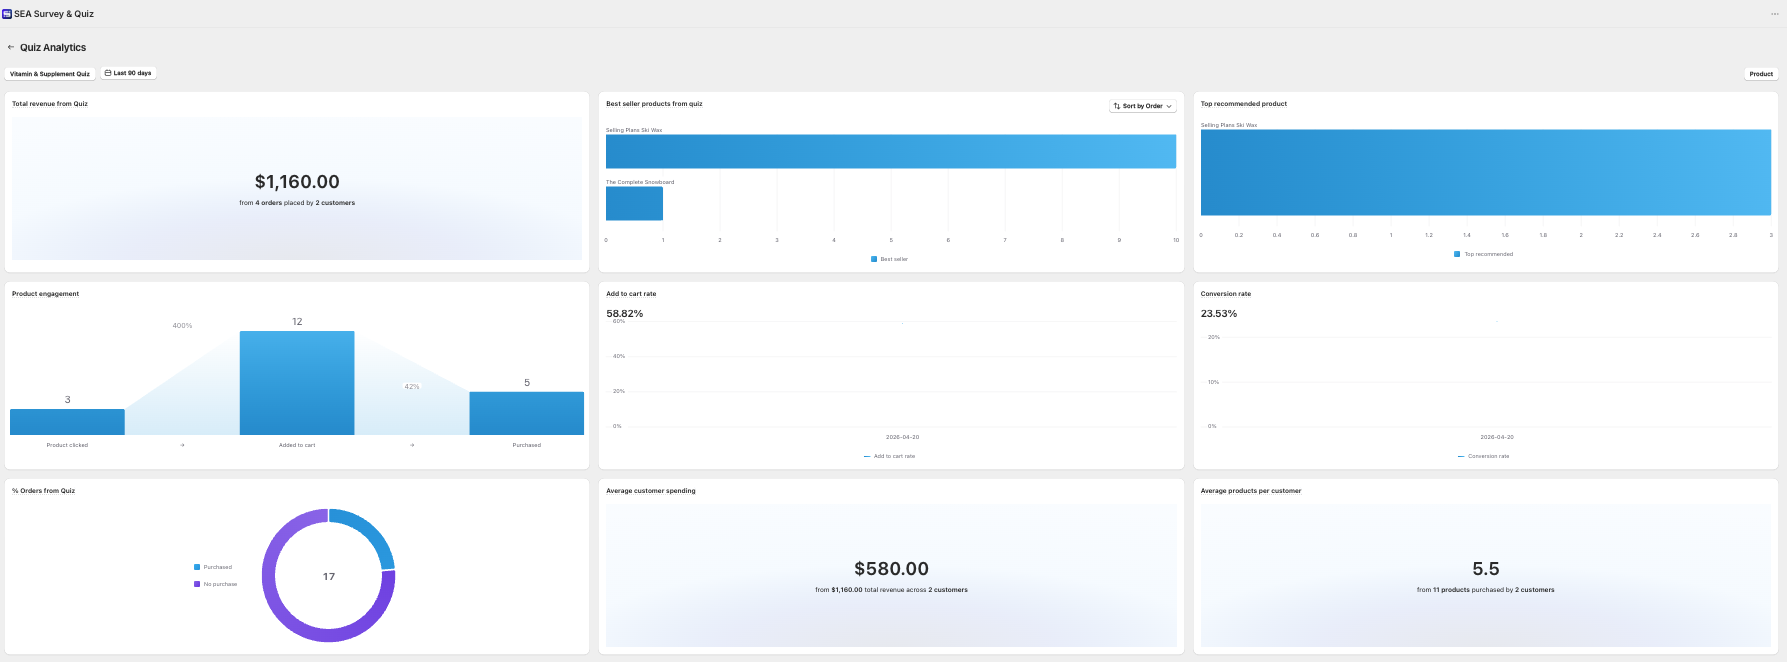
Step 4: Switch to Product Analytics
In the top right corner, click the toggle and select Product to see the revenue and conversion impact of your quiz:
- Total revenue from Quiz: Revenue from orders placed by customers who completed the quiz
- Best seller products from quiz: Top-selling products from quiz traffic
- Top recommended product: Product your quiz recommends most
- Product engagement: Funnel from Product clicked to Added to cart to Purchased
- Add to cart rate: Percentage of customers who added a product to cart after the quiz
- Conversion rate: Percentage of quiz completions that led to a purchase
- % Orders from Quiz: Share of total orders attributed to the quiz
- Average customer spending: Average revenue per customer who completed the quiz
- Average products per customer: Average number of products purchased per customer
Step 5: Unlock Product Analytics (if needed)
Product Analytics is locked by default. Click Contact inside the tab to request access from the support team.
Tips
- Use Most common path to understand which answer combinations lead to purchases, then optimize your quiz logic around those paths
- A high drop-off in the funnel between Started to Completed usually means the quiz is too long or a question is unclear
- Compare Top recommended product vs Best seller products from quiz to check if your quiz recommendations match what customers actually buy